The KamLAND collaboration has announced an improved measurement of the oscillation between the first two neutrino families based on a 766.3 tonne-year exposure to reactor antineutrinos. This latest analysis also provides evidence of the distortion in the energy spectrum expected from the effects of electron-antineutrino oscillations.
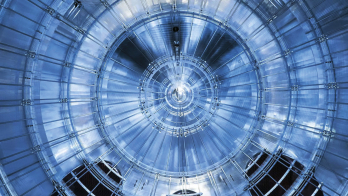
The KamLAND detector, which is based on 1 kilotonne of ultra-pure liquid scintillator, is located near Toyama in Japan, where it is exposed to electron-antineutrinos from 53 nuclear power reactors in Japan, as well as Japanese research reactors and reactors outside Japan. The new results use data collected between March 2002 and January 2003 – or three times the amount of data used in the original measurement, which provided the first evidence that reactor antineutrinos “disappear”. Moreover, improvements in the analysis have allowed the fiducial volume of the detector to be increased by 33%.
With the new analysis, KamLAND observed 258 events with electron-antineutrino energies above 3.4 MeV, compared with 365.2 events expected if there were no neutrino oscillations. This puts the confidence level for the disappearance of reactor antineutrinos at 99.995%. The collaboration also found that the observed energy spectrum disagrees with the expected spectral shape in the absence of neutrino oscillations at the 99.9% confidence level. It does, however, agree with the distortion expected from electron-antineutrino oscillation effects.
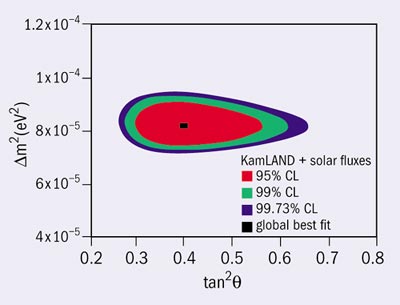
The first analysis from KamLAND, taken together with results from solar neutrino experiments, already restricted the parameter space for two neutrinos, favouring the large mixing angle solution. The latest two-neutrino oscillation analysis of the larger data sample gives a best-fit point at Δm2 = 8.3 x 10⁻⁵ eV2 and tan2θ = 0.41. This disfavours the larger values of Δm2 that KamLAND previously allowed. A two-neutrino global analysis of data from KamLAND and from solar neutrino experiments, together with the assumption of CPT invariance, further restricts the parameter space, as shown in the figure, with a best fit for the combined analysis at Δm2 = 8.2 + 0.6 – 0.5 x 10⁻⁵eV2 and tan2θ = 0.40 + 0.09 – 0.07.


