In recent years, no Standard Model prediction has come under greater scrutiny than the magnetic moment of the muon. The Courier caught up with Muon g-2 Theory Initiative chair Aida El-Khadra on conflicting datasets, disparate calculations and hot competition between research groups.

To begin, could you explain what the muon’s magnetic moment is, and why it should be anomalous?
Particles react to magnetic fields like tiny bar magnets, depending on their mass, electric charge and spin – a sort of intrinsic angular momentum lacking a true classical analogue. These properties combine into the magnetic moment, along with a quantum-mechanical g-factor which sets the strength of the response. Dirac computed g to be precisely two for electrons, with a formula that applies equally to the other, then-unknown, leptons. We call any deviation from this value anomalous. The name stuck because the first measurements differed from Dirac’s prediction, which initially was not understood. The anomalous piece is a natural probe of new physics, as it arises entirely from quantum fluctuations that may involve as-yet unseen new particles.
What ingredients from the Standard Model go into computing g–2?
Everything. All sectors, all particles, all Standard Model (SM) forces contribute. The dominant and best quantified contributions are due to QED, having been computed through fifth order in the fine structure constant α. We are talking about two independent calculations of more than 12,000 Feynman diagrams, accounting for more than 99.9% of the total SM prediction. Interestingly, two measurements of α disagree at more than 5σ, resulting in an uncertainty of about two parts per billion. While this discrepancy needs to be resolved, it is negligible for the muon g–2 observable. The electroweak contribution was computed at the two-loop level long ago, and updated with better measured input parameters and calculations of nonperturbative effects in quark loops. The resulting uncertainty is close to 40 times smaller than that of the g–2 experiment. Then, the overall uncertainty is determined by our knowledge of the hadronic corrections, which are by far the most difficult to constrain.
What sort of hadronic effects do you have in mind here? How are they calculated?
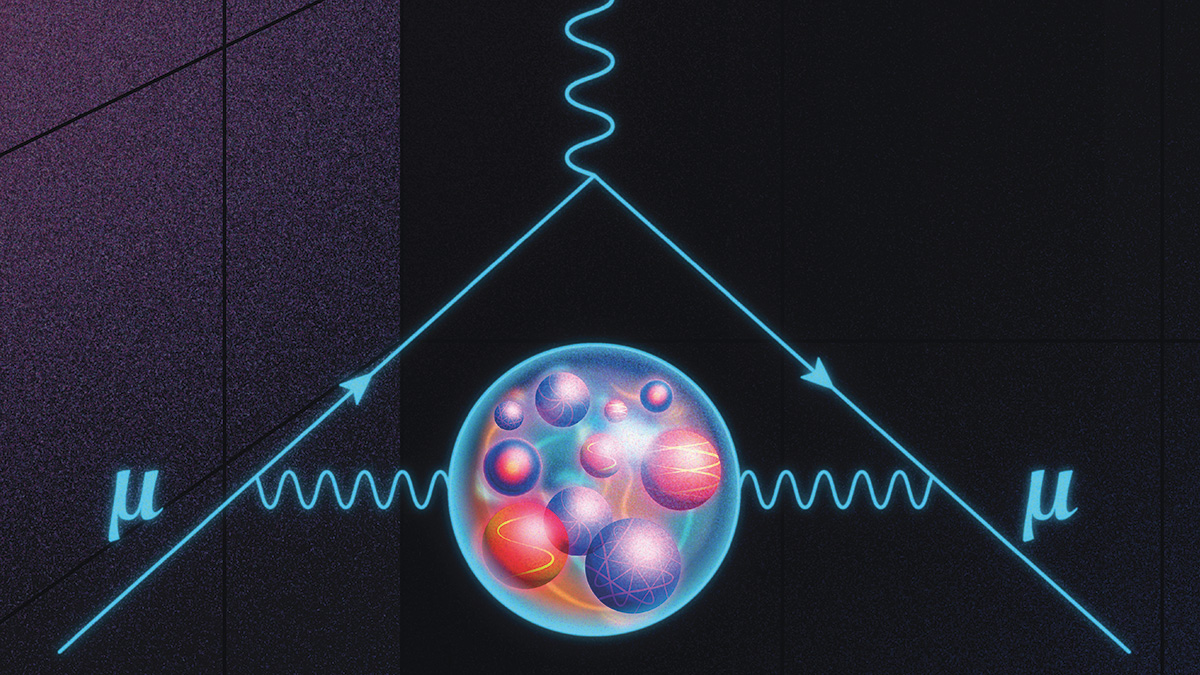
There are two distinct effects: hadronic vacuum polarisation (HVP) and hadronic light-by-light (HLbL). The former arises at second order in α, is the larger of the two, and the largest source of uncertainty. While interacting with an external magnetic field, the muon emits a virtual photon that can further split into a quark loop before recombining. The HLbL contribution arises at third order and is now known with sufficient precision. The challenge is that loop diagrams must be computed at all virtual energies, down to where the strong force (QCD) becomes non-perturbative and quarks hadronise. There are two ways to tackle this.
Instead of computing the hadronic bubble directly, the data-driven “dispersive” approach relates it to measurable quantities, for example the cross section for electron–positron annihilation into hadrons. About 75% of the total HVP comes from e+e– → π+π–, so the measurement errors in this channel determine the overall uncertainty. The decays of tau leptons into hadrons can also be used as inputs. Since the process is mediated by a charged W boson, instead of a photon, it requires an isospin rotation from the charged to the neutral current. At low energies, this is another challenging non-perturbative problem. While there are phenomenological estimates of this effect, no complete theoretical calculation exists – which means that the uncertainties are not fully quantified. Differing opinions on how to assess them led to controversy over the inclusion of tau decays in the SM prediction of g–2. An alternative to data-driven methods is lattice QCD, which allows for ab initio calculations of the hadronic corrections.
What does “ab initio” mean, in this context?
It means that there are no simplifying assumptions in the QCD calculation. The approximations used in the lattice formulation of QCD come with adjustable parameters and can be described by effective field theories of QCD. For example, we discretise space and time: the distance separating nearest-neighbour points is given by the lattice spacing and the effective field theory guides the approach of the lattice theory to the continuum limit, enabling controlled extrapolations. To evaluate path integrals using Monte Carlo methods, which themselves introduce statistical errors, we also rotate to imaginary time. While not affecting the HVP, this limits the quantities we can compute.
How do you ensure that the lattice predictions are unbiased?
Good question! Lattice calculations are complicated, and it is therefore important to have several results from independent groups for consolidating averages. An important cultural shift in the community is that numerical analyses are now routinely blinded to avoid confirmation bias, making agreements more meaningful. This shifts the focus from central values to systematic errors. For our 2025 White Paper (WP25), the main lattice inputs for HVP were obtained from blinded analyses.
How did you construct the SM prediction for your 2025 White Paper?
To summarise how the SM prediction in WP25 was obtained, sufficiently precise lattice results for HVP arrived just in time. Since measurements of the e+e– → π+π– channel are presently in disagreement with each other, the 2025 prediction solely relied on the lattice average for the HVP. In contrast, the 2020 White Paper (WP20) prediction employed the data-driven method, as the lattice-QCD results were not precise enough to weigh in.
With the experiment’s expected precision jump, it seemed vital for theory to follow suit
While the theory error in WP25 is larger than in WP20, it is a realistic assessment of present uncertainties, which we know how to improve. I stress that the combination of the SM theory error being four times larger than the experimental one and the remaining puzzles, particularly on the data-driven side, means that the question “Does the SM account for the experimental value of the muon’s anomalous magnetic moment?” has not yet been satisfactorily answered. Given the high level of activity, this will, however, happen soon.
Where are the tensions between lattice QCD, data-driven predictions and experimental measurements?
All g–2 experiments are beautifully consistent, and the lattice-based WP25 prediction differs from them by less than one standard deviation. At present, we don’t know if the data-driven method agrees with lattice QCD due to the differences in the e+e– → π+π– measurements. In particular, the 2023 CMD-3 results from the Budker Institute of Nuclear Physics are compatible with lattice results, but disagree with CMD-2, KLOE, BaBar, BESIII and SND, which formed the basis for WP20. All the experimental collaborations are now working on new analyses. BaBar is expected to release a new e+e– → π+π– result soon, and others, including Belle II, will follow. There is also ongoing work on radiative corrections and Monte Carlo generators, both of which are important in solving this puzzle. Once the dust settles, we will see whether the new data-driven evaluation agrees with the lattice average and the g–2 experiment. Either way, this may yield profound insights.
How did the Muon g–2 Theory Initiative come into being?
The first spark came when I received a visiting appointment from Fermilab, offering resources to organise meetings and workshops. At the time, my collaborators and I were gearing up to calculate the HVP in lattice QCD, and the Fermilab g–2 experiment was about to start. With the experiment’s expected precision jump, it seemed vital for theory to follow suit by bringing together communities working on different approaches to the SM contributions, with the goal of pooling our knowledge, reducing theoretical uncertainties and providing reliable predictions.
As Fermilab received my idea positively, I contacted the RBC collaboration and Christoph Lehner joined me with great enthusiasm to shape the effort. We recruited leaders in the experimental and theoretical communities to our Steering Committee. Its role is to coordinate efforts, organise workshops to bring the community together and provide the structure to map out scientific directions and decide on the next steps.
What were the main challenges you faced in coordinating such a complex collaboration?
With so many authors and such high stakes, disagreements naturally arise. In WP20, a consensus was emerging around the data-driven method. The challenge was to come up with a realistic and conservative error estimate, given the up to 3σ tensions between different data sets, including the two most precise measurements of e+e– → π+π– at the time.
As we were finalising our WP20, the picture was unsettled by a new lattice calculation from the Budapest–Marseille–Wuppertal (BMW) collaboration, consistent with earlier lattice results but far more precise. While the value was famously in tension with data-driven methods, the preprint also presented a calculation of the “intermediate window” contribution to the HVP– about 30% of the total – which disagreed with a published RBC/UKQCD result and with data-driven evaluations (CERN Courier March/April 2025 p21). Since BMW was still updating their results and the paper wasn’t yet published, we described the result but excluded it from our SM prediction. Later, in 2023, further complications came from the CMD-3 measurement.
Consolidation between lattice results was first observed for the intermediate window contribution, in 2022 and 2023. This, in turn, revealed a tension with the corresponding data-driven evaluations. Results for the difficult-to-compute long-distance contributions arrived in late fall 2024, yielding consolidated lattice averages for the total HVP, where we had to sort out a few subtleties. This was intense – a lot of work in very little time.
On the data-driven side, we faced the aforementioned tensions between the e+e– → π+π– cross-section measurements. In light of these discrepancies, consensus was reached that we would not attempt a new data-driven average of HVP for WP25, leaving it for the next White Paper. Real conflict arose on the assessment of the quality of the uncertainty estimates for HVP contributions from tau decays and on whether to include them.
And how did you navigate these disagreements?
When the discussions around the assessment of tau-decay uncertainties stopped to converge, we proposed a conflict resolution procedure using the Steering Committee (SC) as the arbitration body, which all authors signed. If a conflict is brought to the SC for resolution, SC members first engage all parties involved to seek resolution. If none is found, the SC makes a recommendation and, if appropriate, the differing scientific viewpoints may be reflected in the document, followed by the recommendation. In the end, just having a conflict-resolution process in place was really helpful. While the SC negotiated a couple of presentation issues, the major disagreements were resolved without triggering the process.
The goal of WP25 was to wrap up a prediction before the announcement of the final Fermilab g–2 measurement. Adopting an internal conflict-resolution process was essential in getting our result out just in time, six days before the deadline.
Lattice QCD has really come of age
What other observables can benefit from advances in lattice QCD?
There are many, and their number is growing – lattice QCD has really come of age. Lattice QCD has been used for years to provide precise predictions of the hadronic parameters needed to describe weak processes, such as decay constants and form factors. A classic example, relevant to the LHC experiments, is the rare decay Bs → μ+μ–, where, thanks to lattice QCD calculations of the Bs-meson decay constant, the SM prediction is more precise than current experimental measurements. While precision continues to improve with refined methods, the lattice community is broadening the scope with new theoretical frameworks and improved computational methods, enabling calculations once out of reach – such as the (smeared) R-ratio, inclusive decay rates and PDFs.