Ever-increasing luminosity, advances in computing and the creativity of the LHC experiments are driving event displays to new levels of sophistication for physics and outreach activities, finds Kristiane Bernhard-Novotny.
The first event displays in particle physics were direct images of traces left by particles when they interacted with gases or liquids. The oldest event display of an elementary particle, published in Charles Wilson’s Nobel lecture from 1927 and taken between 1912 and 1913, showed a trajectory of an electron. It was a trail made by small droplets caused by the interaction between an electron coming from cosmic rays and gas molecules in a cloud chamber, the trajectory being bent due to the electrostatic field (see “First light” figure). Bubble chambers, which work in a similar way to cloud chambers but are filled with liquid rather than gas, were key in proving the existence of neutral currents 50 years ago, along with many other important results. In both cases a particle crossing the detector triggered a camera that took photographs of the trajectories.
Following the discovery of the Higgs boson in particular, outreach has become another major pillar of event displays
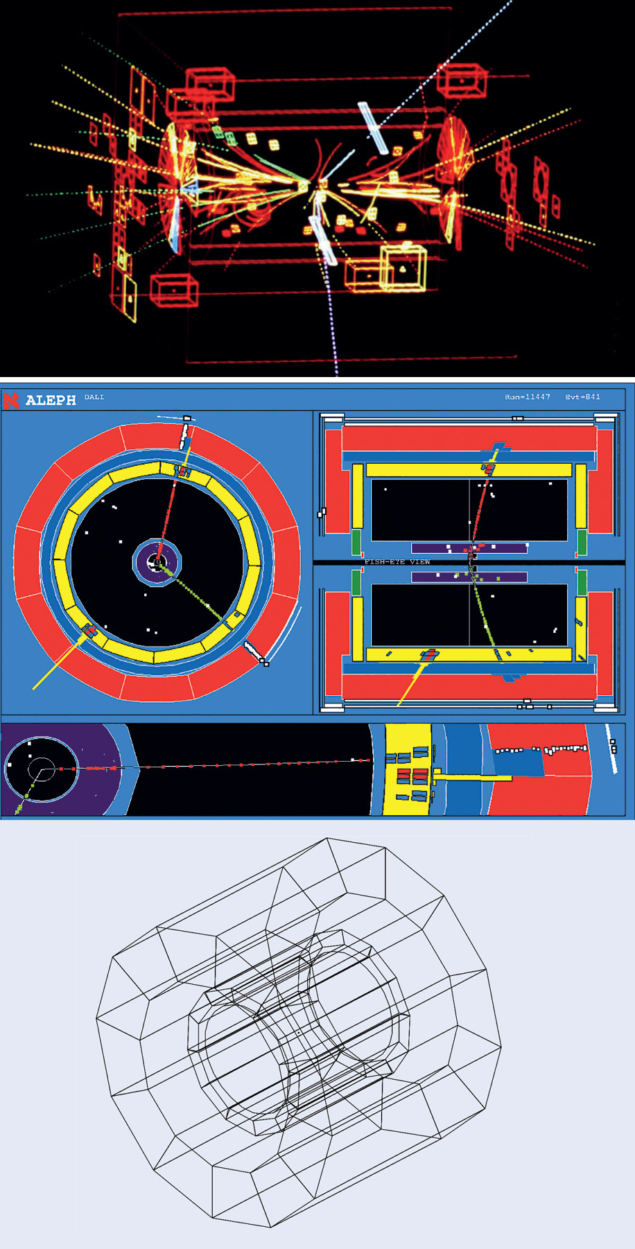
Georges Charpak’s invention of the multi-wire proportional chamber in 1968, which made it possible to distinguish single tracks electronically, paved the way for three-dimensional (3D) event displays. With 40 drift chambers, and computers able to process the large amounts of data produced by the UA1 detector at the SppS, it was possible to display the tracks of decaying W and Z bosons along the beam axis, aiding their 1983 discovery (see “Inside events” figure, top).
Design guidelines
With the advent of LEP and the availability of more powerful computers and reconstruction software, physicists knew that the amount of data would increase to the point where displaying all of it would make pictures incomprehensible. In 1995 members of the ALEPH collaboration released guidelines – implemented in a programme called Dali, which succeeded Megatek – to make event displays as easy to understand as possible, and the same principles apply today. To make them better match human perception, two different layouts were proposed: the wire-frame technique and the fish-eye transformation. The former shows detector elements via a rendering of their shape, resulting in a 3D impression (see “Inside events” figure, bottom). However, the wire-frame pictures needed to be simplified when too many trajectories and detector layers were available. This gave rise to the fish-eye view, or projection in x versus y, which emphasised the role of the tracking system. The remaining issue of superimposed detector layers was mitigated by showing a cross section of the detector in the same event display (see “Inside events” figure, middle). Together with a colour palette that helped distinguish the different objects, such as jets, from one other, these design principles prevailed into the LHC era.

The LHC not only took data acquisition, software and analysis algorithms to a new level, but also event displays. In a similar vein to LEP, the displays used to be more of a debugging tool for the experiments to visualise events and see how the reconstruction software and detector work. In this case, a static image of the event is created and sent to the control room in real time, which is then examined by experts for anomalies, for example due to incorrect cabling. “Visualising the data is really powerful and shows you how beautiful the experiment can be, but also the brutal truth because it can tell you something that does not work as expected,” says ALICE’s David Dobrigkeit Chinellato. “This is especially important after long shutdowns or the annual year-end-technical stops.”
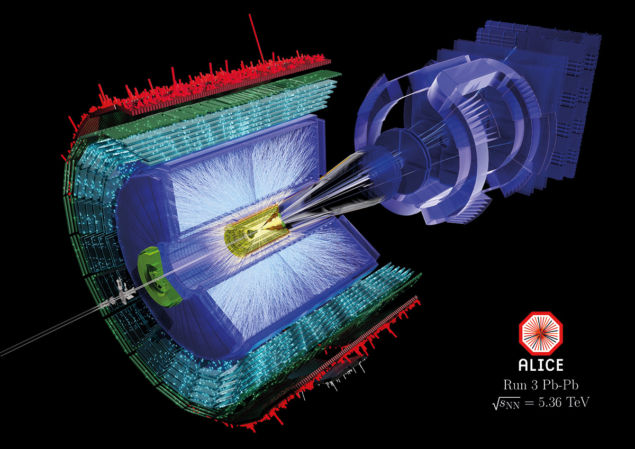
Largely based on the software used to create event displays at LEP, each of the four main LHC experiments developed their own tools, tailored to their specific analysis software (see “LHC returns” figure). The detector geometry is loaded into the software, followed by the event data; if the detector layout doesn’t change, the geometry is not recreated. As at LEP, both fish-eye and wire-frame images are used. Thanks to better rendering software and hardware developments such as more powerful CPUs and GPUs, wire-frame images are becoming ever more realistic (see “LHC returns” figure). Computing developments and additional pileup due to increased collisions have motivated more advanced event displays. Driven by the enthusiasm of individual physicists, and in time for the start of the LHC Run 3 ion run in October 2022, ALICE experimentalists have began to use software that renders each event to give it a more realistic and crisper view (see “Picture perfect” image). In particular, in lead–lead collisions at 5.36 TeV per nucleon pair measured with ALICE, the fully reconstructed tracks are plotted to achieve the most efficient visualisation.
ATLAS also uses both fish-eye and wire-frame views. Their current event-display framework, Virtual Point 1 (VP1), creates interactive 3D event displays and integrates the detector geometry to draw a selected set of particle passages through the detector. As with the other experiments, different parts of the detector can be added or removed, resulting in a sliced view. Similarly, CMS visualises their events using in-house software known as Fireworks, while LHCb has moved from a traditional view using Panoramix software to a 3D one using software based on Root TEve.
In addition, ATLAS, CMS and ALICE have developed virtual-reality views. VP1, for instance, allows data to be exported in a format that is used for videos and 3D images. This enables both physicists and the public to fully immerse themselves in the detector. CMS physicists created a first virtual-reality version during a hackathon, which took place at CERN in 2016 and integrated this feature with small modifications in their application used for outreach. ALICE’s augmented-reality application “More than ALICE”, which is intended for visitors, overlays the description of detectors and even event displays, and works on mobile devices.
Phoenix rising
To streamline the work on event displays at CERN, developers in the LHC experiments joined forces and published a visualisation whitepaper in 2017 to identify challenges and possible solutions. As a result it was decided to create an experiment-agnostic event display, later named Phoenix. “When we realised the overlap of what we are doing across many different experiments, we decided to develop a flexible browser-based framework, where we can share effort and leverage our individual expertise, and where users don’t need to install any special software,” says main developer Edward Moyse of ATLAS. While experiment-specific frameworks are closely tied to the experiments’ data format and visualise all incoming data, experiment-agnostic frameworks only deal with a simplified version of the detectors and a subset of the event data. This makes them lightweight and fast, and requires an extra processing step as the experimental data need to be put into a generic format and thus lose some detail. Furthermore, not every experiment has the symmetric layout of ATLAS and CMS. This applies to LHCb, for instance.

Phoenix initially supported the geometry and event- display formats for LHCb and ATLAS, but those for CMS were added soon after and now FCC has joined. The platform had its first test in 2018 with the TrackML computing challenge using a fictious High-Luminosity LHC (HL-LHC) detector created with Phoenix. The main reason to launch this challenge was to find new machine-learning algorithms that can deal with the unprecedented increase in data collection and pile-up in detectors expected during the HL-LHC runs, and at proposed future colliders.
Painting outreach
Following the discovery of the Higgs boson in particular, outreach has become another major pillar of event displays. Visually pleasing images and videos of particle collisions, which help in the communication of results, are tailor made for today’s era of social media and high-bandwidth internet connections. “We created a special event display for the LHCb master class,” mentions LHCb’s Ben Couturier. “We show the students what an event looks like from the detector to the particle tracks.” CMS’s iSpy application is web-based and primarily used for outreach and CMS masterclasses, and has also been extended with a virtual-reality application. “When I started to work on event displays around 2007, the graphics were already good but ran in dedicated applications,” says CMS’s Tom McCauley. “For me, the big change is that you can now use all these things on the web. You can access them easily on your mobile phone or your laptop without needing to be an expert on the specific software.”

Being available via a browser means that Phoenix is a versatile tool for outreach as well as physics. In cases or regions where the necessary bandwidth to create event displays is sparse, pre-created events can be used to highlight the main physics objects and to display the detector as clearly as possible. Another new way to experience a collision and to immerse fully into an event is to wear virtual-reality goggles.
An even older and more experiment-agnostic framework than Phoenix using virtual-reality experiences exists at CERN, and is aptly called TEV (Total Event Display). Formerly used to show event displays in the LHC interactive tunnel as well as in the Microcosm exhibition, it is now used at the CERN Globe and the new Science Gateway centre. There, visitors will be able to play a game called “proton football”, where the collision energy depends on the “kick” the players give their protons. “This game shows that event displays are the best of both worlds,” explains developer Joao Pequenao of CERN. “They inspire children to learn more about physics by simply playing a soccer game, and they help physicists to debug their detectors.”
Further reading
M Bellis et al. 2018 arXiv:1811.10309.
H Drevermann et al. 1995 CERN-ECP-95-25.
C T R Wilson 1927 “On the cloud method of making visible ions and the tracks of ionizing particles”, Nobel Lecture.


